Leaderboard


Popular Content
Showing content with the highest reputation on 01/11/23 in all areas
-
Спасибо за рефбек! Doradus $1.2 Tether TRC-20 11 Jan 2023 22:08:45 26189938e4854795b74c584267fa7a205b3eb7944216f73a3adbe386fcfa0dde1 point
-
10.01.23 12:13ReceiveReceived Payment 0.5 USD from account U17701077 to account U29442019. Batch: 500675968. Memo: API Payment. Викторина в чате Profit-Hunters BIZ.1 point
-
🎊 New year, new partners 🎊 MinePlex has partnered with Bitgert! It is a secure and scalable blockchain ecosystem. MinePlex CrossFi unique project combining the stability and liquidity of traditional financial instruments with the security and transparency of blockchain has the potential to change the industry with partners like this. More information can be found here: https://mineplex.io/1 point
-
I nominee Binance1 point
-
Review USD/JPY 27.04.2018 Fundamental analysis: for more than a month, since March 23, there is a short-term bullish trend, moving up from the "bottom" in the area of 104.626. Today from news on Japan – BoJ Interest Rate Decision and BoJ Press Conference. Important news for the USA: Gross Domestic Product Annualized, Core Personal Consumption Expenditures, Michigan Consumer Sentiment Index. Technical analysis: long-term bullish trend from 2012, which began at 76.073, is not unfolded. Since November 2017 yen in the medium-term bearish trend. In the H4 chart, we note that the bullish trend is supported by volumes, the «Alligator» has opened its fall upwards. Trading recommendations: at H1 chart, «Аlligator» is the second day of the "buried past", it is a signal to lock in profits. Special attention is paid to the resistance level of 109.500 and to the news, which is abundant today. With a reliable downward movement below the two - day low of 108.814-the transition to short positions. Sincerely, Sergey Ryazantsev - financial analyst of brokerage company AMEGA Source: Forex analysis from the broker AMEGA1 point
-
Review EUR/JPY 06.04.2018 Fundamental analysis: since mid-February, the currency pair has entered a relatively narrow price corridor of 132.000-129.000, and has not yet got out of it. For a year, from April 17, 2017, the medium – term trend is bullish. Perhaps what we are seeing now is attempts to reverse the trend. After the "peaks" on 137.503 price go down. There is no important news on the European Union and Japan today, but the BOE's Governor Mark Carney speech and Fed's Jerome H. Powell Speech - should be taken into account. We all remember last year's volatility, including EUR, on Brexit news. Technical analysis: long-term trend since 2012 is bullish. On the H1 chart, the «Alligator» indicator has «closed its jaws», indicating a state of uncertainty. Over the past few weeks, there have been three false breakouts of the resistance level at 131.500, and now the price is again near this mark. Trading recommendations: near the strong resistance level and the psychologically important mark 131.500, powerful price movements are likely, we will try to use this to make a profit. Long positions - with a reliable breakdown of this level. Short positions when the price rebounds and moves below 130.500. Sincerely, Sergey Ryazantsev - financial analyst of brokerage company AMEGA1 point
-
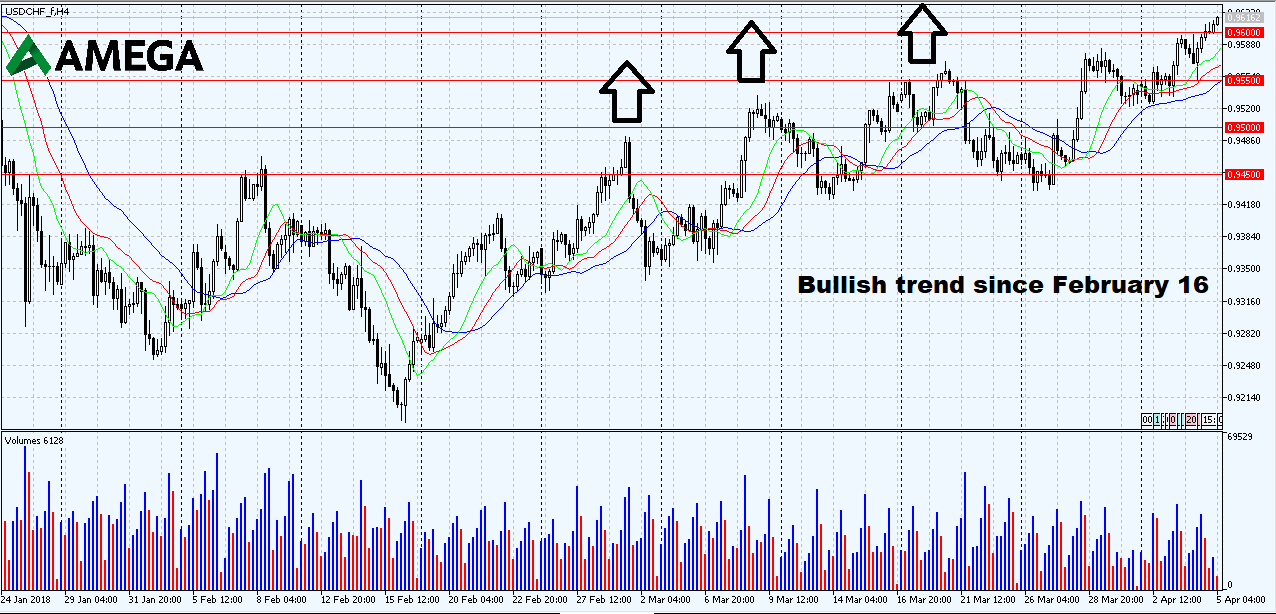
Review USDCHF 05.04.2018 Fundamental analysis: short - term trend-bullish, on March 27 the Swiss franc pushed away from the "bottom" near 0.94326 and confidently goes up. If you look back a little, it is obvious that bullish dynamics has been maintained for the third consecutive month, which began with 0.91864 rise has not yet turned,which tells us about the strength of the trend. From important news for today – the Trade Balance and Initial Jobless Claims in the USA, as well as FOMC Member Raphael W. Bostic speech. Technical analysis: long-term trend-bearish since 2000, 18 years. Perhaps now we are seeing a slow reversal, since 2011 the pair is trading in a relatively narrow (for MN chart) price range from 0.70444 to 1.03458. The strong resistance level at 0.96000 is broken, and the price does not think to stop yet. Trading recommendations: the main focus is on long positions above 0.96000. Let's pay attention to an important psychological moment – the price on the main working timeframes H1 and H4 somehow rests against the top of the screen, it seems (but is not) too high. It is comfortable to play on the rebound down – and it often turns out to be a fraud. Such a powerful price movement often speaks of its willingness to continue in this direction, rather than a rapid reversal. Cancel this scenario breakdown in reliable support at 0.94235, then go on sale. Sincerely, Sergey Ryazantsev - financial analyst of brokerage company AMEGA
 1 point
 -
Review NZD/USD 04.04.2018 Fundamental analysis: the current week for the New Zealand dollar is developing according to the bullish scenario. After low volatility during Bank holiday Monday and last Friday (due to Catholic Easter) price goes up powerfully, twice, updating daily highs staying until the level 0.72953. Today's news on USD -the ADP Employment Change, ADP Employment Change and FOMC Member Loretta J. Mester speech - can significantly affect the course. Technical analysis: the short-term bullish trend, which started on March 20 from 0.71516, is still continuing. The medium - term trend is also bullish, which began on November 17, 2017, the rise from 0.67779 reliable signs of a reversal does not yet show. The coincidence of medium- and short-term trends is a good buy signal. Trading recommendations: the long - term trend has also been bullish since 2009. Unidirectional movement of the three trends is not so often, so the priority-long positions, while continuing to move above 0.73000. On H1 the indicator "Alligator" good "opened its mouth". Cancel this scenario breakdown of the support level 0.71870. Sincerely, Sergey Ryazantsev - financial analyst of brokerage company AMEGA1 point
-
OIL/#CL/USD - technical analysis On the 27th of March the Shanghai International Energy Exchange started to trade Oil for national currency. The contract signed in September with the start prize of 416 yuans per barrel was sold for 440 yuans. The price quotations for oil have reduced at the Forex market after opening of the trading session. The price per barrel has reduced from 66.55 to 65.45 US dollars. In fact, this reduction has been a long time coming in terms of a technical analysis: MACD was bought from the 17th of November 2017 and tries to unload from time to time, but the bulls turns out to be strong enough all the time. Now everything is ready for short-term reduction in the daily time frame, it is not surprising that the Asian session has been started from the south. Trade plan for the day: H4 sets to a decline to the support level of 62.90. Taking into account that the bulls not only manage to reach the key level of 65.00, but also to remain on this level. The traders have to keep waiting, as the right moment to start trading was missed. Alert for the 65.10. Monitor the condition of the pair coming to this level in order to open shot positions. Attention! The forecasts presented in the review are a private opinion of the author. Comments to them are not recommendations for trading or guidance on working in financial markets. AMEGA does not bear any responsibility for possible direct or indirect losses (or other types of loss) that may arise in the case of use of review materials. The author's punctuation, orthography and stylistics are preserved in the review.1 point
-
Technical analysis 21.03.18 – GOLD/USD Today the main intrigue of the last weeks will be finally revealed: at 6 pm (UTC) FOMS will announce its decision on the main interest rate. American dollar is going to be really flexible. The GOLD/USD has been trading in a relatively slight flat since March, 15. Such long-time currency flotation is explained by the loss of market interest to the protective assets. All of the bidders clearly want to get “fast money”. Fundamentalists expect that Fed will stick to the more aggressive approach in relation to the interest rate revision, carrying out the procedure not three, but four times a year. It is anticipated that everything that will be said at the meeting will be reflected in USD quotation and consequently in the gold quotation as well. In expert opinion, any stern action can have a positive impact on the US dollar so that precious metal prices are likely to decline. According to the technical analysis, there is a prolonged range. Being almost flat, MACD draws weak rising summits just slightly above zero. Inspired by the idea of decline, Stochastiks has already headed the south, but in fact they were joined by the lightweight MACD, have given out the signal to sell. In such circumstances, if the fall happens, then it will be not so deep and stay within the existing band. Trade plan for today: on the daily time frame the value is on both sides clamped by the movings 1318 (МА18) and 1304 (МА100). H1 is ready to move up to the zone 1315-1324. The buy entrance from support levels is 1312, 1310. If the market shows such heights in the prospect, it will be definitely worthwhile to sell from these levels. Attention! The forecasts presented in the review are a private opinion of the author. Comments to them are not recommendations for trading or guidance on working in financial markets. AMEGA does not bear any responsibility for possible direct or indirect losses (or other types of loss) that may arise in the case of use of review materials. The author's punctuation, orthography and stylistics are preserved in the review.1 point